
Users mainly design reports in the report designer,specifically, it is: You can choose different types of reports (such as bar charts, line charts), select data source, configure different report graphic styles.
Main interface
报表设计器的界面布局如下图,包括:【导航栏】、【图形选择区】、【画布区】、【属性设置面板】。
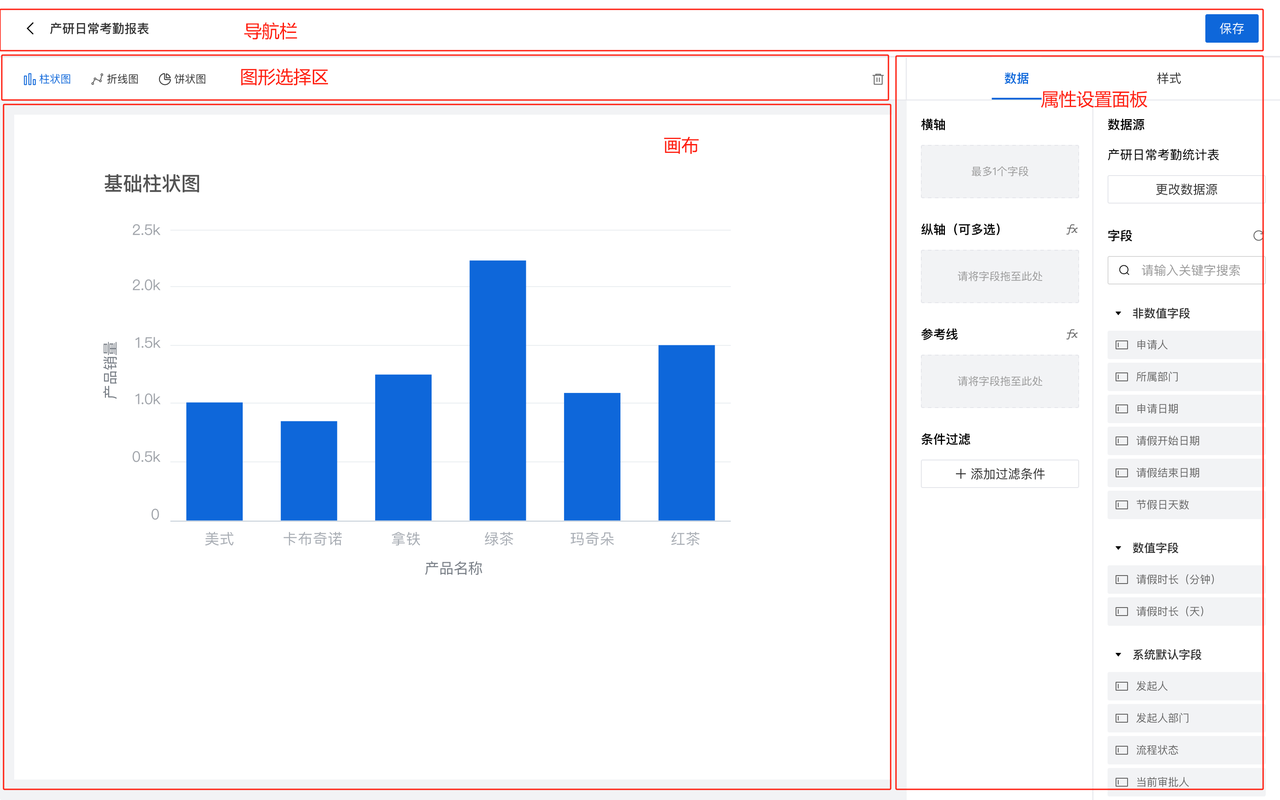
顶部导航栏:可以做一些常用操作,比如:撤回,恢复,清空,保存,分享等
图形选择区:列出可供选择的图形类型,如柱状图、饼状图等。
画布区:描述用户如何在画布上绘制所选图形,并进行位置和大小的调整。
属性设置面板:
1-设置数据源:用户可以选择数据源,数据源的范围是:本应用内的所有表单和视图(视图第一期先不做)
2-自定义样式:提供样式编辑选项,如颜色、字体、标签等。