
Users mainly design reports in the report designer,specifically, it is: You can choose different types of reports (such as bar charts, line charts), select data source, configure different report graphic styles.
Main interface
The interface layout of the report designer is shown in the following figure, include: [navigation bar], [Chart selection area], [Canvas area], [Attribute Settings Panel].
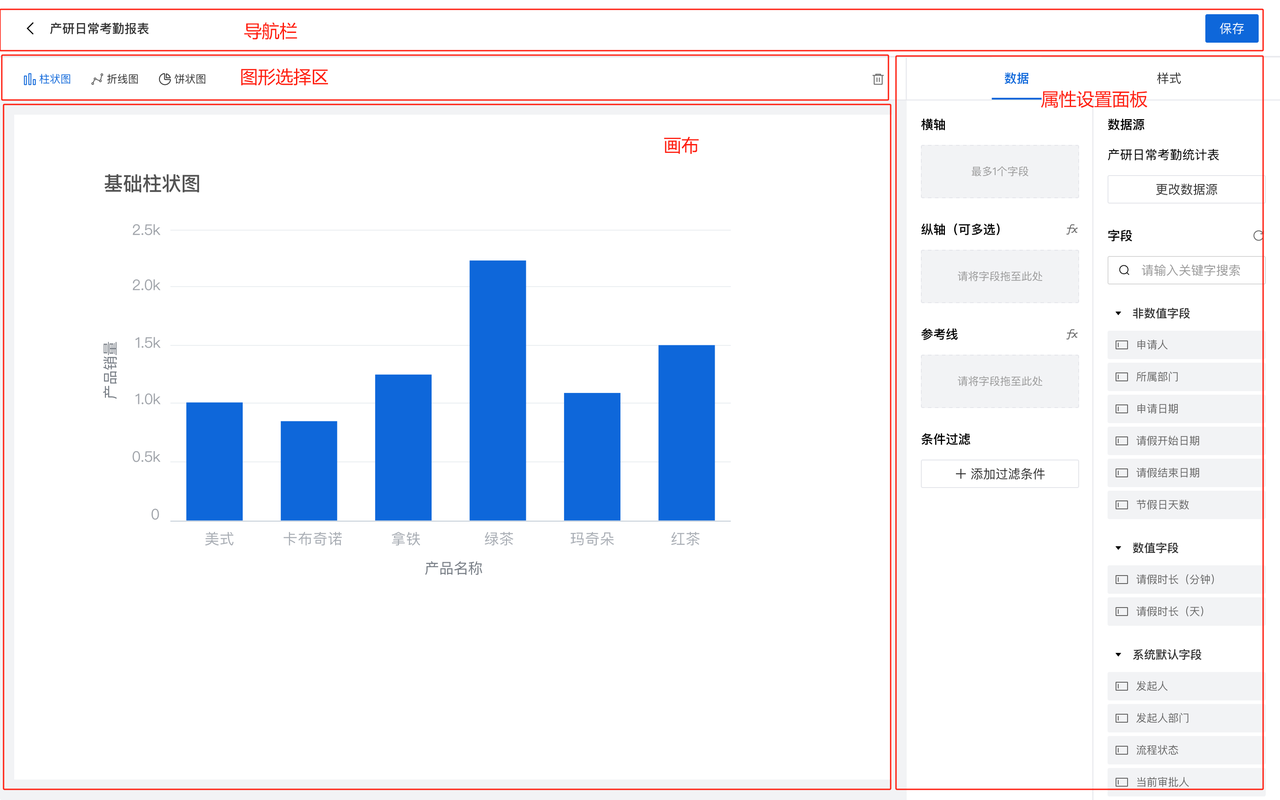
图形选择区:列出可供选择的图形类型,如柱状图、饼状图等。
画布区:描述用户如何在画布上绘制所选图形,并进行位置和大小的调整。
属性设置面板:
1-设置数据源:用户可以选择数据源,数据源的范围是:本应用内的所有表单和视图(视图第一期先不做)
2-自定义样式:提供样式编辑选项,如颜色、字体、标签等。